Which carrier is costing you more this quarter? LogisPro knows.
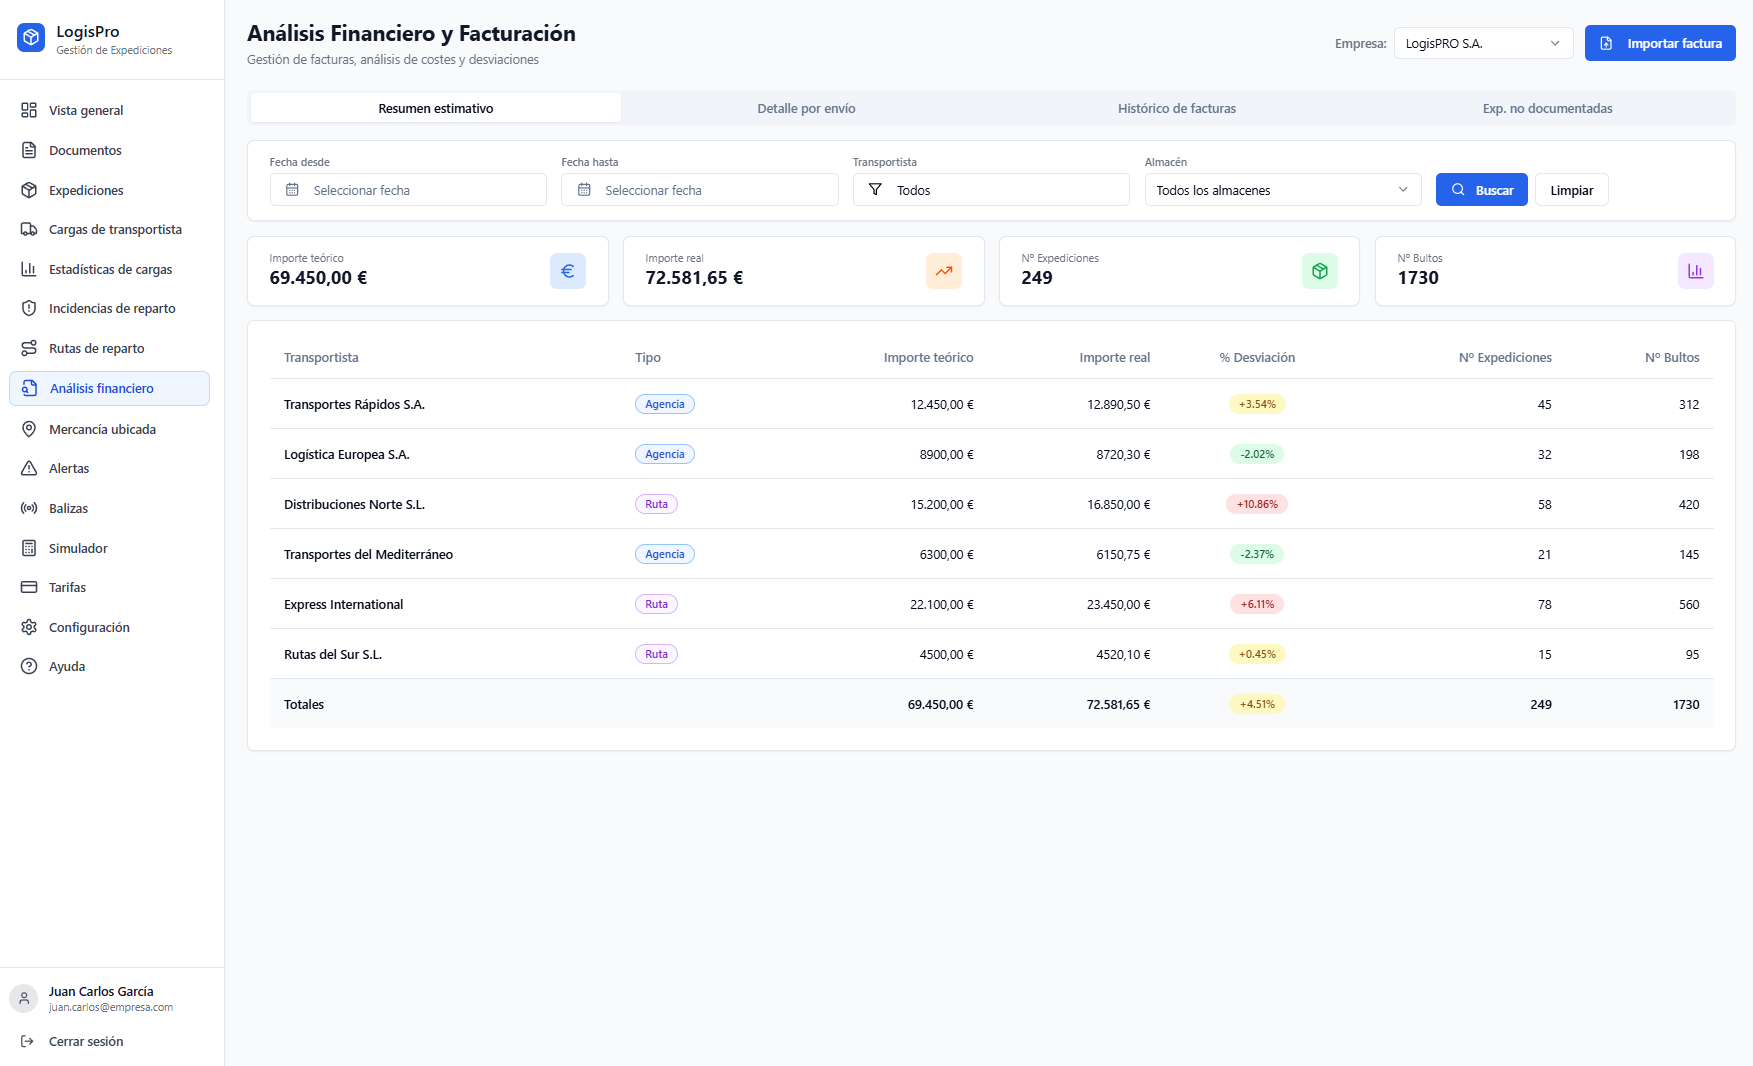
Cost dashboards by operator, route and customer. Alerts when a rate deviates from its history. Export to your BI or Excel effortlessly. The analytics you need to negotiate with your own data.
- Real cost by carrier, route, weight and destination.
- Automatic alerts when an invoice deviates from the pattern.
- Native export to Power BI, Tableau, Looker or Excel.
Real-time data · BI Export · Configurable alerts
High-value Dashboard
Your information, your way
LogisPro lets you create fully customized dashboards:
- Real-time KPIs with visual indicators
- Customizable charts (bar, line, donut)
- Configuration by time range
- Each user defines their own metrics
- Overall status of multiple warehouses
- Configurable fields by user role
Temporal Performance
Analyze trends and compare periods to optimize operations
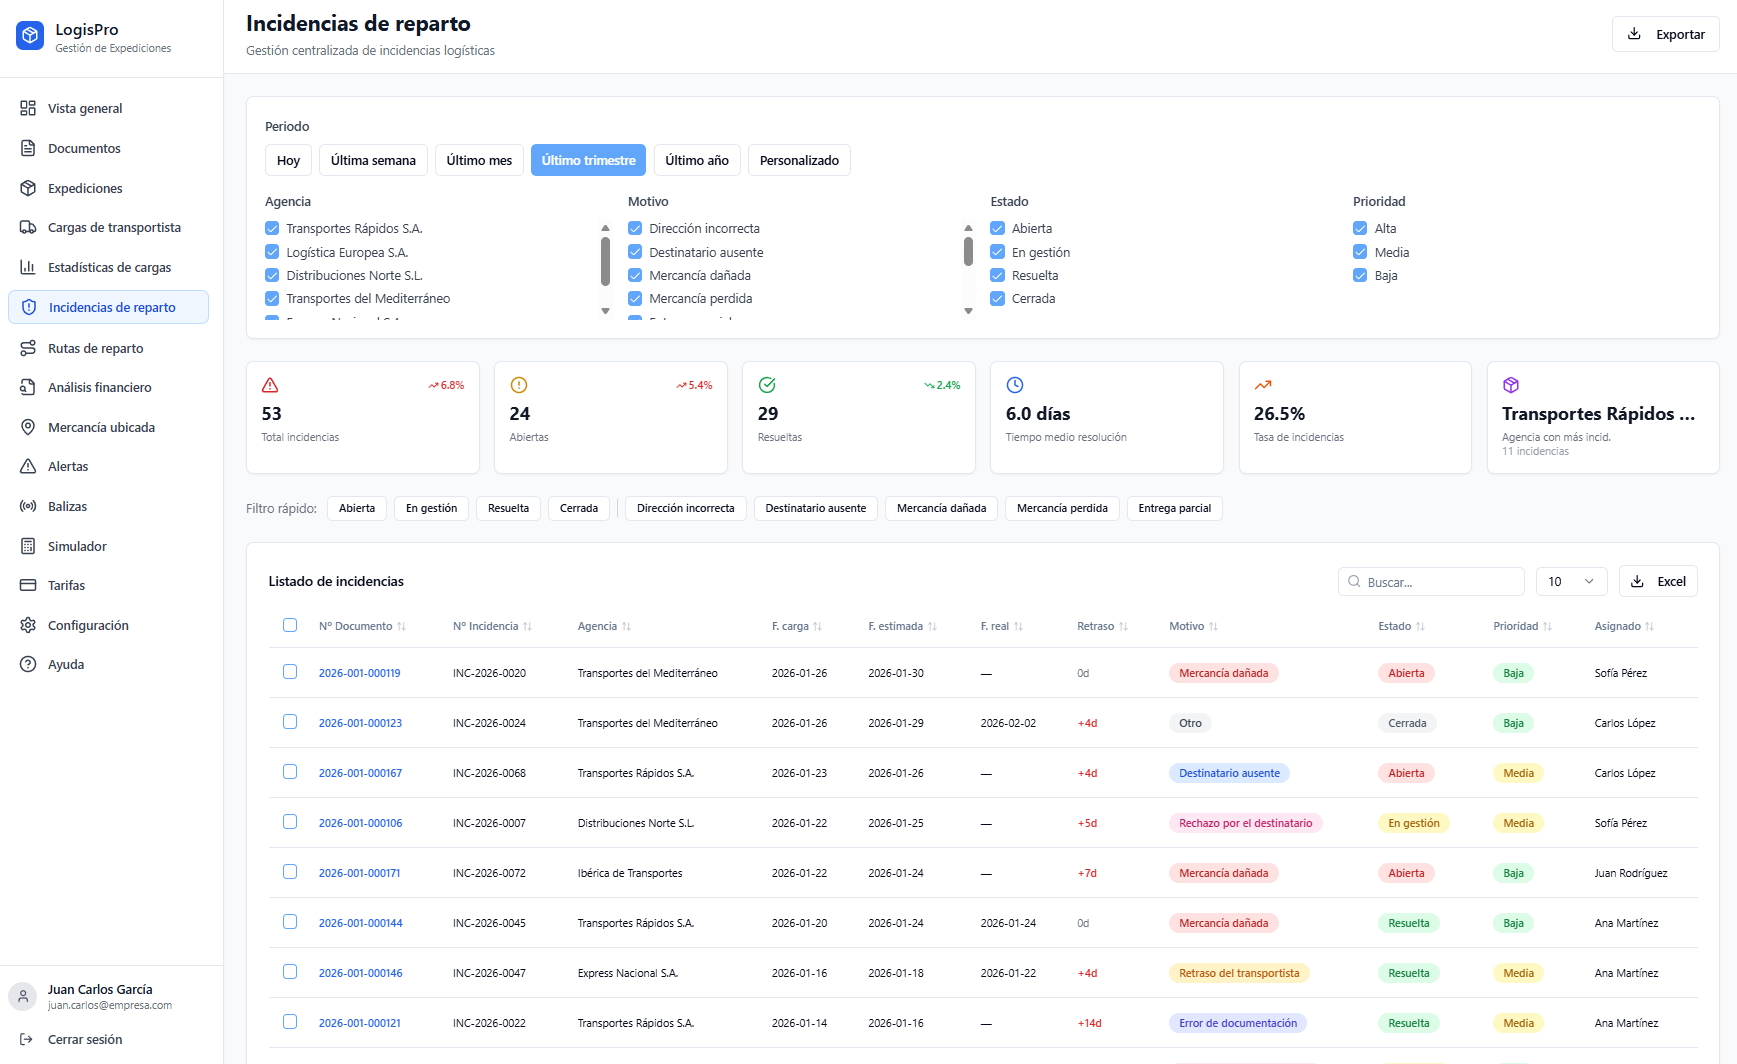
Incident Control
Detect, register and resolve problems before they affect customers
Predictive Intelligence
Pattern Detection
Does agency X always have delays on Tuesdays? System identifies it automatically.
Automatic Alerts
If a route exceeds 10% incidents, system alerts for quick intervention.
Dispute Analysis
Complete log of claims, causes, and resolutions for negotiation.
Reliability Score
Each carrier has real-time updated score based on their performance.
Strategic Analysis
Data that transform tactical decisions into competitive advantage
Destination Ranking
What are your 10 most frequent destinations? Optimize inventory and negotiate better with carriers.
Cost Trends
Evolution of cost per shipment, by destination, by carrier. Accurate budgets for upcoming quarters.
Carrier Comparisons
Performance of each carrier in price, speed, incidents. Data for renegotiating againstcts.
Volume and Seasonality
Predict demand peaks, plan capacity, avoid excess costs from lack of foresight.
Internal Benchmarking
Compare warehouses, teams, and periods. Identify best practices to replicate across operations.
Export and Compatibility
Your data, in the format you need, when you need it
Multiple Output Formats
Don't be trapped in LogisPro. Export to the formats your organization uses:
- CSV / Excel for quick analysis
- Compatible with Power BI
- Compatible with Tableau
- REST API for custom integrations
- Automatic scheduled reports
Automated Reports
Automatic sending every Monday with KPIs from previous week, trends, and critical alerts.
Customizable: Each user receives only data relevant to their role.
System Alerts
Never miss an important issue
KPIs you can monitor
Delivery Times
- By region/destination
- By carrier
- By shipment type
- Vs. SLA committed
% Incidents
- By agency
- By route
- By problem type
- Temporal evolution
Pre-invoice
- Monthly estimate by concept
- Average cost per shipment
- Detected excess costs
- Trend vs. budget
Traceability
- 100% of process documented
- From picking to delivery
- Integration with ERP
- Complete audit trail available
Why data matters
Informed Decisions
Don't guess. Real data from your operations enable strategic decisions based on facts, not intuition.
Continuous Optimization
Identify inefficiencies week by week. Small compound improvements generate significant annual savings.
Problem Prevention
Detect patterns before they become crises. Early intervention = lower costs.
Transform data into decisions
Get complete visibility of your logistics operations.
Request analytics demo